
Identify speeding and proactively enforce issues
Urban SDK identifies speeding on all roadways with detailed traffic data, so you can focus on addressing dangerous roadways before they become a larger community issue.


TRAFFIC ENFORCEMENT
Traffic enforcement
powered by AI
Hourly traffic data and analytics tailored to help you pinpoint speeding and trending locations with fewer resources.
CUSTOMER SUCCESS
300+ cities in North
America are making
streets safer

We are realizing great time savings due to having the information "at our fingertips." We are not making nearly as many trips to the field to set up speed/volume tubes.
%201.png)
City of Camas, WA
City of Camas Public Works
.jpeg)
We highly recommend Urban SDK to any city or municipality looking to enhance their traffic management capabilities. You're great people and I have enjoyed working with you immensely.

City of Sanford, FL
City of Sanford Public Works
.jpeg)
The value lies in the analysis, reports, and data. Urban SDK's platform provides easy access to quick, reliable data that helps us make faster decisions. This allows us to focus our energy on the major long-term projects that require significant effort and brainpower.

City of McAllen, TX
City of McAllen Public Works
.jpeg)
Urban SDK provides quick and easy access to speed and traffic counts data that is crucial for public agencies when answering to directly affected stakeholders.

City of El Cajon, CA
City of El Cajon
.jpeg)
Urban SDK has a great support team and user-friendly software. The City of Fort Pierce knows the great benefits the SDK brings to the table.

City of Fort Pierce, FL
City of Fort Pierce Public Works

Now when citizens show up to see if there is a speeding problem on their residential roadway I am able to provide the information without keeping them waiting.

City of Chesapeake, VA
City of Chesapeake Public Works

This is a very quick and easy program to verify speed data throughout the community. Urban SDK allows us to confirm or deny the traffic speed complaints. It also allows our traffic officers to find the areas of higher speed to work on and comply with the posted speed limit.
.png)
City of Fate, TX
City Fate Department Of Public Safety

I really like how easy it is to see in a glance where the hotspots are. We have our patriot and traffic folks focus on a hotspot for the month to see if we can drive down the average and 85th percentile speeds ... [using] the software to identify problem areas and then focus enforcement and measure compliance.

City of Farmers Branch, TX
Farmers Branch Police Dept.


HOW IT WORKS
Respond to speeding complaints in 3 steps
Urban SDK identifies excessive speeding on all roadways with detailed traffic data, so you can focus on solving the problem.


Track your entire jurisdiction
Monitor traffic conditions across your entire county, city or by division.


Search for a specific address
Get traffic conditions for a specific address or nearby area.


Validate speeding complaints
Filter by speeds or get a report by selecting any road.
Watch Demo
Hourly traffic speed data and metrics from vehicle telematic and GPS data sources on all your roads.

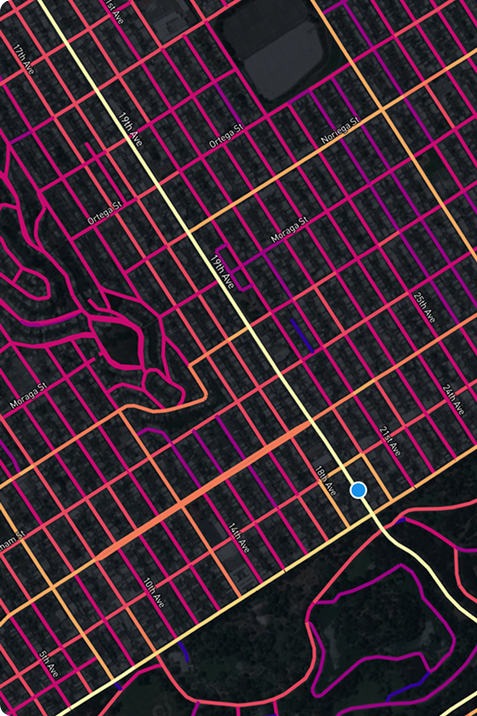
Identify speeding and resolve public complaints
Identify speeding and validate public complaints on any road in a matter of minutes.
61 MPH
85th Percentile Speed
Speed Limit
50 MPH
Average
54 MPH
95%
64 MPH

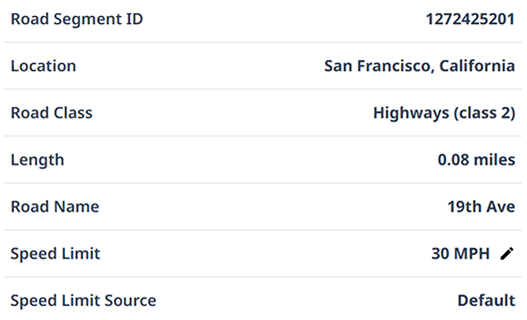
Road Segment ID
776737347
Location
San Francisco, California
Road Class
State Roads (class 3)
Length
0.08078 miles
Road Name
2A
Speed Limit
50 MPH
Speed Limit Source
Urban SDK
Data Layer
Traffic Speed
Gain access to traffic speed from connected vehicles on all your local roads. Insights reports allow users to gauge roadways with average, percentile speeds, and filter by time period or date ranges.
Urban SDK provides precise hourly speed data to evaluate complaints and deploy resources efficiently for the greatest impact to public safety.
Urban SDK provides precise hourly speed data to evaluate complaints and deploy resources efficiently for the greatest impact to public safety.

Daily Traffic
Traffic speeds are reported hourly on all roads without any hardware.

Road Network
Traffic speeds are associated with global linear referencing.

Customizable Analysis & Reporting
Filter traffic data to easily create custom reporting
- Speeds
- Speed Limit
- Road Class
- Segments
- Jurisdiction
- Time Period
- Date Range
- Day of Week
- Custom Route
- Custom Radius, Area, or Zone
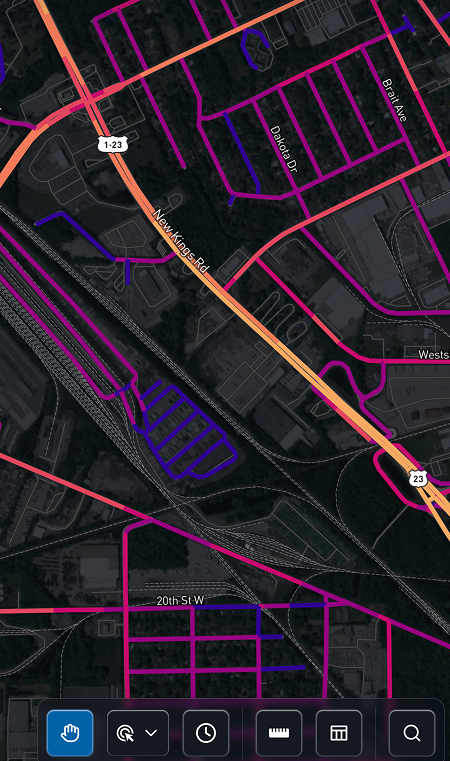
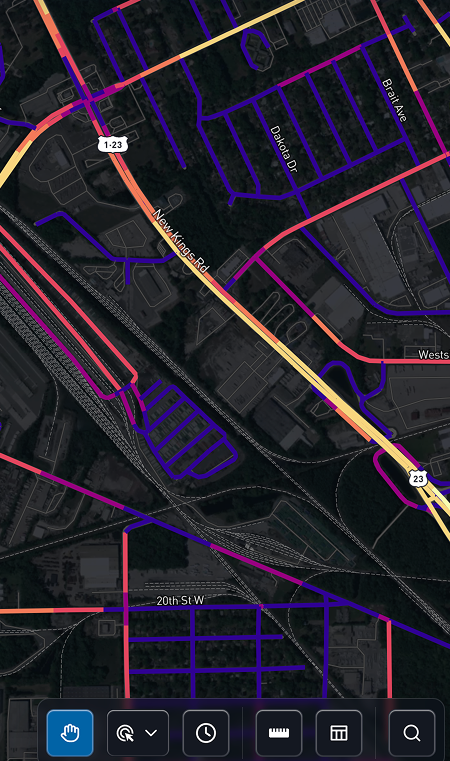
Quickly Identify Speeding to Position Enforcement
Visualize hotspots and compare speeds against posted speed limits.
12 MPH
Over Speed Limit
Speed Limit
45 MPH
85% Difference
12 MPH
95% Difference
17 MPH

Road Segment ID
120906391
Location
San Francisco, California
Road Class
Local (class 5)
Length
0.17523 miles
Road Name
New Kings Rd.
Speed Limit
45 MPH
Speed Limit Source
Urban SDK
Data Layer
Speed Limit Difference
Compare hourly speeds of observed trips on every road segment against the posted speed limit.
Urban SDK provides precise hourly speed data to evaluate complaints and deploy resources efficiently for the greatest impact to public safety.
Urban SDK provides precise hourly speed data to evaluate complaints and deploy resources efficiently for the greatest impact to public safety.
Average Difference
Compare average hourly traffic speeds.
85th & 95th
Compare 85th or 95th percentile hourly traffic speeds.
Import Speed Limits
Import your local speed limit files at any time or leverage Urban SDK's continuous speed limit index.
Mitigate collision risk with road scoring
Identify and rank roads with the highest collision risk from an annual road score.
.png)
0.82 Very High Risk
Collision Index
.png)
Data Layer
Collision Index
Using an index of 5-year historical fatal crashes, traffic volumes, speeding, roadway and neighborhood characteristics, officials can pinpoint hotspots across their entire roadway network.
Urban SDK provides precise hourly speed data to evaluate complaints and deploy resources efficiently for the greatest impact to public safety.
Urban SDK provides precise hourly speed data to evaluate complaints and deploy resources efficiently for the greatest impact to public safety.
Risk Score
The collision index creates a risk score value for each road segment ranging from 0 to 1
Dangerous Roads
Identify and monitor high collision corridors with bookmarks to alert traffic enforcement
Compare trends pre- and post- enforcement
Collision index models risk with collisions, traffic, and roadway design
- Intersection widths
- Sidewalks & facility widths
- School Zones
- Traffic Speed
- Collisions
- Signage
Get traffic volume on every road without hard counts
Daily and annual traffic volumes are available on every road. Counts are refreshed automatically.
2,400 Vehicles / Hour
AAHT
Road Segment ID
23614104
Location
San Francisco, California
Road Class
Local (class 5)
Length
0.06338 miles
Road Name
Pierce St
Speed Limit
30 MPH
Speed Limit Source
Urban SDK
Data Layer
Traffic Volume
Gain access to VMT and AADT on all your local roads with Urban SDK’s Traffic Volume Data. See how many cars are traveling along your roadways, and quickly share what roads are operating at capacity.
Urban SDK provides precise hourly speed data to evaluate complaints and deploy resources efficiently for the greatest impact to public safety.
Urban SDK provides precise hourly speed data to evaluate complaints and deploy resources efficiently for the greatest impact to public safety.
Annual Average Daily Traffic
Annual average daily traffic (AADT) measures how much traffic uses a road or highway in a year.
Vehicle Miles Traveled
Vehicle miles traveled (VMT) measures the amount of travel for all vehicles over a segment.
TRAFFIC ENFORCEMENT FEATURES
80% of citizen complaints
are a perception problem
Urban SDK provides precise hourly speed data to evaluate complaints and deploy resources efficiently for the greatest impact to public safety.
Urban SDK provides precise hourly speed data to evaluate complaints and deploy resources efficiently for the greatest impact to public safety.

Target Speeding
Identify hot spots, validate monthly speeding trends and monitor vulnerable areas like school zones.

Improve Safety
Crash and citations location information to compare speed trends month over month

Fast Response
Respond to citizen complaints sooner with address search and exportable reporting

Deploy Assets
Generate maps for traffic enforcement by time of day, location or division to deploy officers to known problem areas.
PREVIEW DEMO
EXPERIENCE OUR PLATFORM
View traffic data and analytics to replace manual data collection,
save your staff time, and overcome budget shortfall.

Traffic Calming
VALIDATE SAFETY IMPROVEMENTS
Explore our traffic calming solution providing speed, volume, and collision risk on every road in your community.

Traffic Enforcement
Target speeding hotspots
Explore our traffic enforcement solution providing speeding and collision risk hotspots to assign patrol by time of day.

Traffic Delay
monitor commuting & Traffic Signals
Explore our traffic delay solution to monitor travel time, traffic signal timing, and critical commuting corridors.
Traffic Calming
Explore our traffic calming solution providing speed, volume, and collision risk on every road in your community.
Traffic Enforcement
Explore our traffic enforcement solution providing speeding and collision risk hotspots to assign patrol by time of day.
Travel Delay
Explore our traffic delay solution to monitor travel time, traffic signal timing, and critical commuting corridors.
FREE TRIAL
Get Speeding Hotspots In Your Inbox
Urban SDK automates complaint response and targeted speeding enforecement for public safety.
