
Articles
Measuring Transportation Equity
In order to foster transportation equity, officials must first understand the causes of inequity and chart where it exists — tasks that can be equal parts complex and complicated.
In order to foster transportation equity, officials must first understand the causes of inequity and chart where it exists — tasks that can be equal parts complex and complicated.
Once a transit agency or state transportation department decides it wants to make equity part of its mission, they must choose how they measure it.
As a complex socioeconomic phenomenon, inequity in the United States has many different aspects that no measure captures fully. It also varies from state to state — and even within states.
Challenges in to measuring equity
For instance, access to affordable housing is a major problem in New York City due to a lack of it, while in Buffalo the cost is less a barrier than is unemployment and poverty. Both problems manifest in similar ways, but result from different issues and have different solutions.
According to TransitCenter, a key equity issue in transportation is representation in governance.
Many initiatives in city and transportation planning are introduced via public meetings. The comments and concerns from participants often guides projects. And the people at these meetings are the citizens who can make it, which is not necessarily a representative cross section.
Research has shown that even in largely minority neighborhoods, public meetings are still more heavily frequented by older, wealthier, white residents.
This means that projects incorporating public comments will reflect their wants and interests, which may or may not align with those of low income residents or people of color in the neighborhood.
Spatial equity
A popular way to measure equity, or the lack thereof, is spatial equity.
Modern mapping tools, like Urban SDK, can import and visualize data from the United States Census or the more frequent American Community Survey, allowing for a very fine grained look at where people live relative to a city or region’s geography.
Spatial equity can reveal household income, some commute data, and even job data that result in fascinating analyses.
For example, Boston’s Orange Line was once an elevated railway south of Downtown to its terminus at Forest Hills station. By the 1980s the structure was deteriorating, the stations were too small to accommodate longer trains, and there were no elevators or escalators.
Officials decided it would make more sense to tear down the el and reroute the Orange Line on new tracks to the west through a cutting built for a highway. It would have been similar to the Red Line in the Dan Ryan Expressway in Chicago, with the rail and stations between a superhighway.
The highway project was eventually canceled, but the rerouting continued.
This left the neighborhoods the Orange Line once served without service, which happened to be poorer and home to more poor and Black Bostonians than average. Meanwhile, neighborhoods benefiting from the change tended to be wealthier and whiter.
The neighborhoods that lost Orange Line Service had no rail service until the 2010s, when the Fairmount Line entered service after years of activism. However, ridership has been lower than expected despite the need for transit in the neighborhoods it serves.
The data shows why: most commuters in the area work hourly jobs, and trains only come about once an hour. As such, this limits the service’s effectiveness at getting them to and from work on time.
Equity matrix
Portland, Oregon has an innovative method of measuring transportation equity, which many cities are looking at adopting. Called the equity matrix, it scores projects across a number of dimensions.
According to the Portland Bureau of Transportation, which developed it, the matrix uses race, ethnicity, and income data from the US Census to rank each census tract in Portland to “embed the work of transforming systems that impacts marginalized groups and helps us make these systems more equitable”.
According to the National League of Cities, the equity matrix helps Portland prioritize transportation projects in areas where they would be most beneficial. This has helped get projects done such as transit priority corridors and improvements to street safety.
Importance of measuring transportation equity
Being able to measure equity is important, but it’s important to remember that the data is dependent on participation.
For example, many experts believe that the Census undercounts Latinos because of a fear that responding could be used to deport them.
Ultimately, measuring equity must also be a means to an end — improving transportation — not an end in itself. And that starts with making data-driven decisions in order to truly understand and help the communities that need it most.
Learn more about how Urban SDK can help your organization make informed decisions using critical data. Contact our team here.

NEWS
Recent Announcements
See how public sector leaders succeed with Urban SDK.

Company News
Urban SDK Joins Government Technology’s AI Council to Help Shape the Future of AI in the Public Sector
We’re proud to announce that Urban SDK has officially joined the AI Council, part of Government Technology’s Center for Public Sector AI
Company News
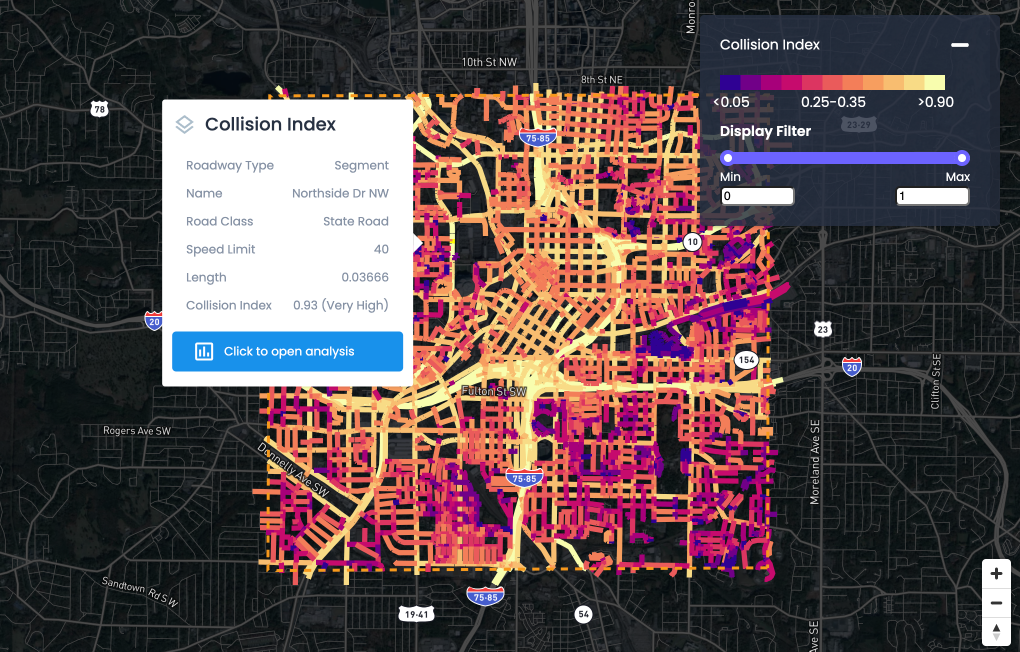
Collision Index: Proactive Traffic Safety Powered by AI
Communities now have another layer of road safety thanks to Urban SDK’s Collision Index

Customer Stories
University of Florida Transportation Institute Partners with Urban SDK to Expand I-STREET Program
Urban SDK and the University of Florida have partnered to expand the university's I-STREET Program
WEBINAR
Identify speeding and proactively enforce issues
See just how quick and easy it is to identify speeding, address complaints, and deploy officers.
