
Customer Stories
How to Turn Transportation Data Into Information
Insights on new sources of data, analyzing data to tell a story, use cases for mobility datasets, and turning data into information
Insights on new sources of data, analyzing data to tell a story, use cases for mobility datasets, and turning data into information
Data is everywhere. Making sense of all this data to tell a story that can inform decision making is one of the major challenges facing transportation planners, traffic engineers, civil engineers, and land use and zoning professionals today.
By turning data into information, public officials are able to tell a compelling mobility and transportation story. A story that provides another layer of transparency to the citizens they serve, and an important foundation for cross-organizational collaboration.
Here are just a few ways mobile data is transforming traffic analysis management and strategies.
Transportation data sources
Transportation planners and professionals can leverage data to tell one broad story that helps them make better, faster more informed decision. Data sources currently being used in traffic analysis and management include, but are not limited to, the following.
Probe sensors and detectors
Probe sensors and detectors are the most traditional forms of collecting mobility data. The upside of these manual count sensors, which include hardware attached to light poles or individual traffic signals, and pneumatic tubes that run across roads, is that they are accurate. The industry has accepted how to use the technology and vendors have experience providing this data collection solution.
Downsides to this mobility data collection method include the expense, the limited scale of data collection (data is only collected where the hardware is located) and limited access with smaller communities (those that can’t afford to deploy these sensors miss out on access to valuable data).
Added to those issues is the fact that probe sensors and detectors are usually prioritized toward bigger roadways, such as interstates and state roads. That means smaller county roads and smaller arterials won’t be as determined in annual planning.
Video cameras
Video cameras are often used to monitor and collect data on parking lots to determine occupancy at different times of day. This technology is also being used for traffic counts and in curb management to analyze when freight vehicles are parked.
Accuracy, ability to leverage existing infrastructure, and multiple use cases are some of the benefits of using video cameras to collect mobility data.
However, drawbacks of this technology include data processing, cost, and limited reach.
Mobile advertising
Mobile advertising is data pulled from ad networks that have access to location services on mobile phones.
Mobile advertising data can be leveraged for a number of data collection use cases, including pedestrian footfall, traffic counts, speed, and transit ridership demand.
It is usually low-cost to pull in mobile ad data, and there is a very high penetration rate based on the number of devices in a locale. This data can be used in a number of use cases, and a high frequency of data that can be pulled nonstop every day.
Some of the issues with mobile advertising data are that it is relatively new and not yet widely used. As such, there is a little bit of an industry learning curve, which will remain until broader adoption and accuracy validation occurs.
Mobile application and ODUs
In the same way advertising data can be collected from users' phones, mobile application data can be procured directly from mobile apps on mobile devices. Anything downloaded to a mobile phone generates geolocation services.
Today there are a number of large mapping GPS navigability companies that allow their non-identifiable aggregated data onto the market. This provides another low-cost way to obtain a strong penetration rate, and to accurately understand how people are moving around.
The only caveat to mobile application data sets is that the user base can fluctuate monthly. There is no way to really know how many monthly users there are, which means data would typically need to be aggregated across multiple applications to reach a statistically relevant penetration rate within a population.
Commercial fleet
Commercial fleet data collected from trucks, delivery vehicles, and city operated vehicles can be leveraged to understand how intermodal systems impact economic development — how accessible a region's jobs and goods are.
From a traffic management perspective, this data can be pulled to analyze travel time, travel distance, and travel time reliability. It can provide visibility into congestion and delivery patterns throughout the day.
While collecting this data can be expensive, and the penetration rate can be a drawback, commercial fleet data usefully provides vehicle classification data that allows planners to understand more about the actual vehicle (e.g., if it is a local delivery truck or an actual freight vehicle).
The frequency of data is daily/nightly, providing a wealth of fleet trip information. It can be used to determine everything from truck mileage travel to curb availability to monitoring freight movement for strategic intermodal decision making.
Shared mobility
Shared mobility data is data collected on scooters and bikes available on curbs, as well as car share programs and fleet ride hailing available in cities.
Companies running these programs release data that can provide insight into new mobility, such as commute mode preference and trips and utilization by mode. Currently, very few of these organizations are monetizing this data, however, relationships with these operators are needed to gain access to their data.
Two significant advantages of shared mobility data collection include the real-time nature of the data and the low cost of procurement.
Last mile delivery
Last mile delivery data from autonomous delivery providers (think drones and autonomous vehicles) is a burgeoning form of data collection.
Telling a story with data
Making an enterprise data plan
There is a tremendous amount of data out there for traffic managers, transportation planners, transit planners — we often hear from these professionals that they have plenty of data but lack information or insights.
To address this, we encourage planners to take that first step of developing an enterprise data plan. This plan does not have to be overwhelming, and can be as simple as answering questions like: how do you store and manage data today?
Adding new data sets to specific analyses requires a good plan for storage, management, and understanding where obstacles may be when turning data into information.
What kind of story should the data tell?
What are the questions that need to be answered?
The answers to these questions will help determine which data sets could potentially be used. It’s not a case of leveraging one great data set — it’s how to merge the data together to answer questions.
What data is actually needed?
The last question we ask is really more about a predictive analytics model — what data is needed to plan a better road or reduce congestion?
This goes beyond reporting.
Officials must identify metrics and determine their goals.
Benefits of an enterprise data platform
To help transportation, transit, and law enforcement professionals answer these questions we made a large investment in building an enterprise data platform.
Urban SDK’s enterprise data platform guides planners on a journey through steps that lead to telling a story with data. The stages of this journey include:
- Descriptive analytics – Asking "what happened" questions. Using safety as an example, descriptive analytics looks at crashes that are occurring, asking basic questions such as what happened; how many fatalities were there; were pedestrians involved; and were there serious injuries?
- Diagnostic analytics – Asking "why it happened" questions. For example, why did the accident occur? Was it due to the curvature of the road? Was it because of the weather or pavement conditions?
- Predictive analytics – Asking questions of correlation. This part of the analytics journey draws correlations, asking things like will weather have an impact; will the curvature of the road have an impact; will road height have an impact? Our platform answers these questions to build a successful model.
- Prescriptive analytics – Answering the questions and prescribing solutions. In this stage of the data journey planners have the data they need to make informed decisions to improve safety and optimize transport and transit systems.
Use cases
Use cases help tell the transportation data story. Some of the use cases that are easy to get started with include:
Traffic counts
Traffic counts data is in high demand and is a good use case starting point. Mobile advertising, mobile app, detector data, commercial vehicle data can all be used in aggregate format to develop daily traffic counts for vehicles, trucks and pedestrian movement.
Newer data sets give us the ability to generate daily information so traffic counts can be reported during peak periods or specific locations. This enables planners to move beyond major freeways and major arterials to smaller minor arterial roads and county roads, which have previously been ignored because of the expense of placing the detectors or pneumatic tubes on them.
Popular commutes
Data can also be aggregated to analyze popular commutes. Using mobile advertising, mobile app and commercial fleet data we can gain a greater understanding of commuter patterns, answering questions like what are the most popular trips, what are the trends and how are trips changing. This insight will be particularly valuable as planners strive to understand the impacts COVID-19 had on commuting patterns.
Speed and travel time
Data can also be pulled to analyze real-time speed patterns and calculate reliability metrics. Because we are pulling data from mobile devices, the user and the mobile phone help put eyes on all aspects of roadways, providing greater access to more roadways than ever before in terms of recording conditions. No hardware is needed to gather the data. This expanded access allows planners to uncover areas of need that might not have been previously identified.
Crash rates
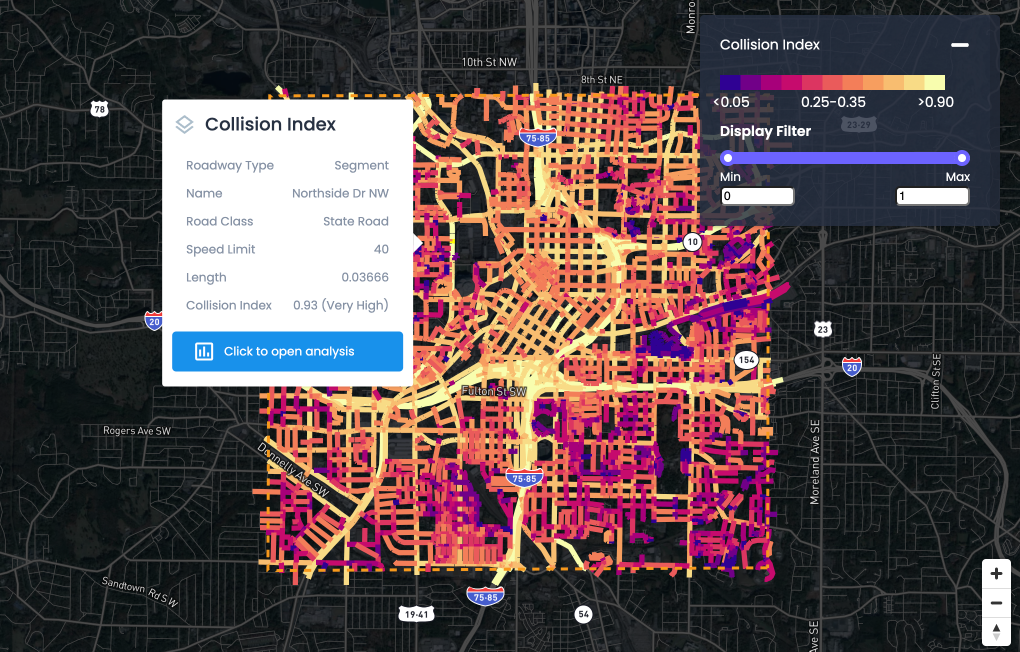
Data can help identify unsafe corridors. This data analyzes how many miles vehicles are traveling through specific roadways and based on this information we are able to determine crash rates. For example, using data from safety sources and mobile data we can determine how many crashes are occurring per 100 million vehicle miles traveled. This data helps tell a much bigger story related to where crashes are occurring and what should be done to reduce crash rates.
Parking demand
Beyond traffic management and traffic analysis another data can help tell a story on parking demand. Data can help municipalities define their true parking needs, surfacing information not only on how much parking is being used — occupancy volumes/rates/revenue, but the time-of-day parking is being used.
Many cities are starting to rethink parking strategies and parking needs. As new business models around parking and city revenue are being rethought, more accurate, real-time data can help inform decisions around these policies.
Turning data into information
Turning data into information to tell the story of transport and mobility can promote regional data sharing, increase funding opportunities and enhance community transparency.
One of the biggest impacts of an enterprise data plan is the ability to understand how the data fits together and how it can be used regionally as an asset. Regional data sharing initiatives are starting to gather momentum as law enforcement agencies, DOTs, urban planning organizations, and civil engineering firms are collaborating more closely. This collaboration is being driven in part by federal grant opportunities centered around developing regional data sharing initiatives. The goal is to provide better access to performance measures and better access to information on the outcome of the projects.
Sharing transportation data with citizens can also increase community transparency. For example, providing information on what roadways are risky at certain times a day can improve safety by helping commuters can avoid them if possible. Community transparency can also be enhanced by providing insight into issues surrounding equitable transport systems and creating dialogue around developing solutions for addressing inequities.
Mobile data is indeed transforming traffic analysis and management, providing dashboards and performance measures for improving transport systems across communities.
Looking for ways to turn your data into information? Throw some time on our calendar and let's talk!

NEWS
Recent Announcements
See how public sector leaders succeed with Urban SDK.

Company News
Urban SDK Joins Government Technology’s AI Council to Help Shape the Future of AI in the Public Sector
We’re proud to announce that Urban SDK has officially joined the AI Council, part of Government Technology’s Center for Public Sector AI
Company News
Collision Index: Proactive Traffic Safety Powered by AI
Communities now have another layer of road safety thanks to Urban SDK’s Collision Index
Customer Stories
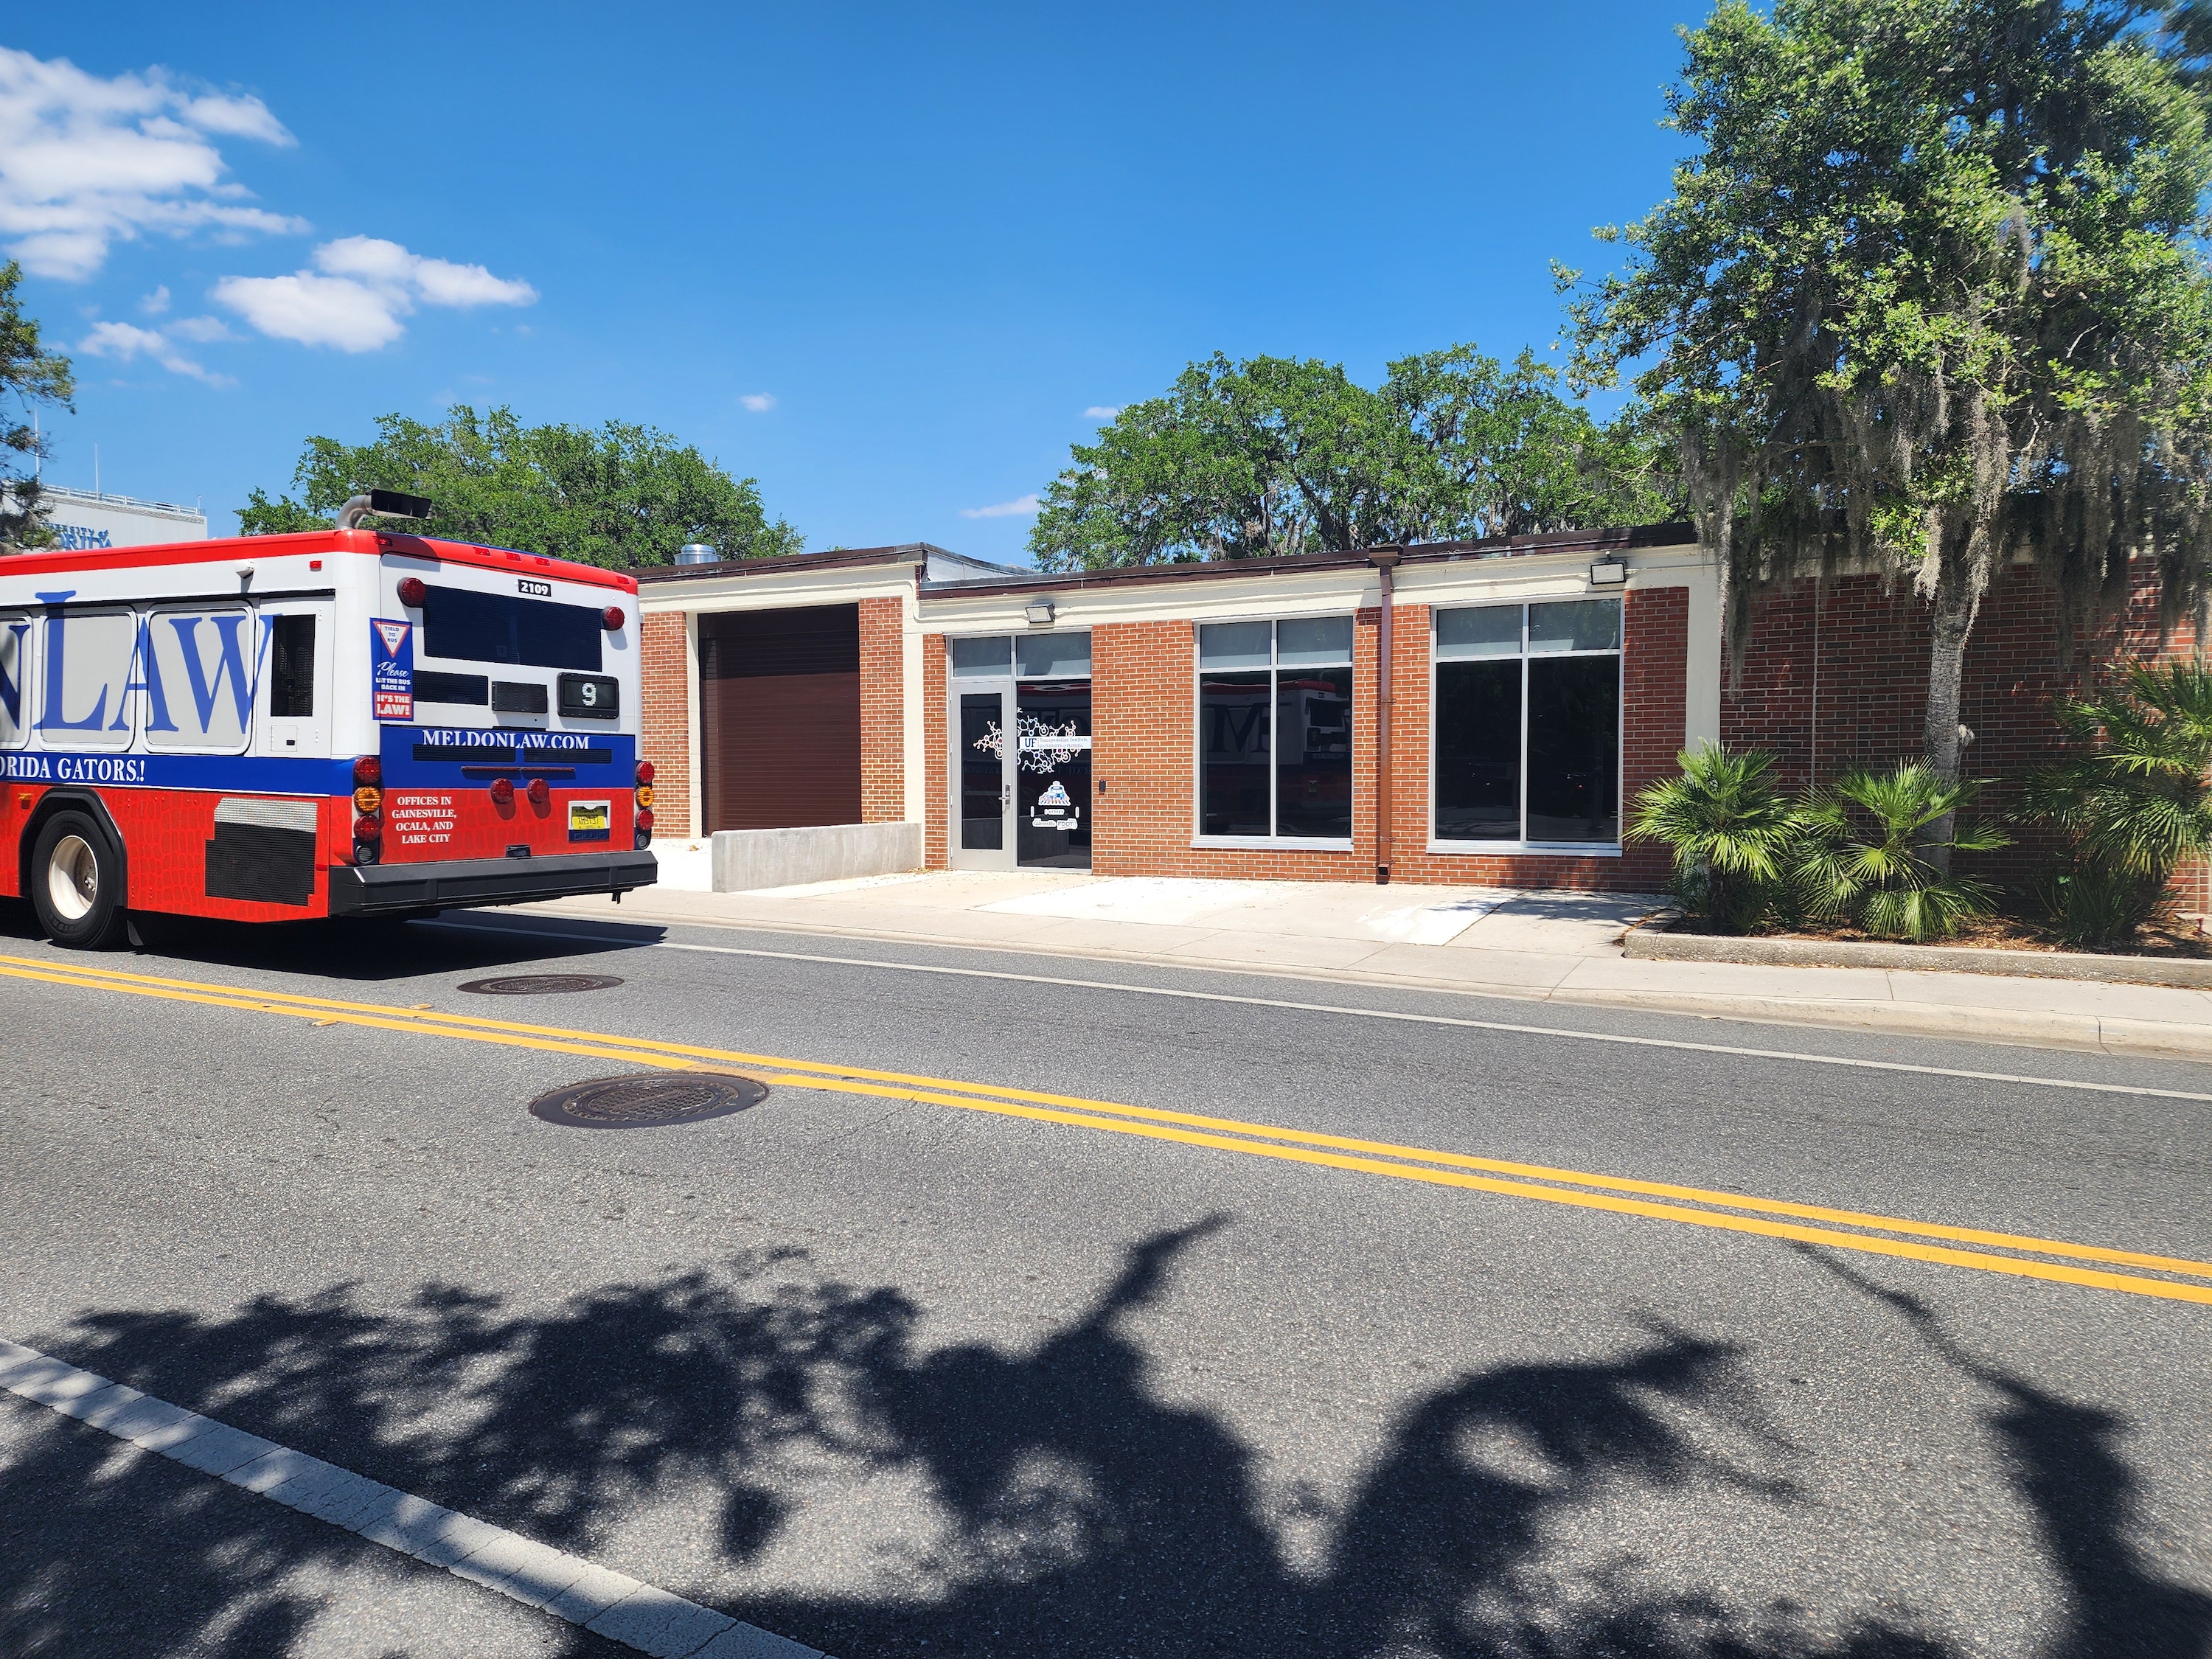
University of Florida Transportation Institute Partners with Urban SDK to Expand I-STREET Program
Urban SDK and the University of Florida have partnered to expand the university's I-STREET Program
WEBINAR
Identify speeding and proactively enforce issues
See just how quick and easy it is to identify speeding, address complaints, and deploy officers.
