
Customer Stories
Urban SDK releases NEVI Rank to rank states by EV Charger network effectiveness and equitable access.
States and transportation planners now have a new tool to aid in statewide electric vehicle (EV) network planning to meet National Electric Vehicle Infrastructure Formula Program (NEVI Formula) guidelines for locating EV charging stations.
Urban SDK, a mobility analytics company, has developed a national analysis and digital planning tool that enables state planners to rank EV charger network effectiveness and equity. The NEVI Rank tool, which is free to use, allows planners to analyze their state’s current EV network by charger locations, occupancy demand, socioeconomics, and population information, for comparison to national averages.
The tool comes as the Biden administration has released sweeping climate and infrastructure laws intended to reduce greenhouse gas emissions by 40% by the end of the decade. For local and state policymakers to meet the NEVI Formula requirements and deploy 500,000 charging stations nationwide in the proposed infrastructure bill.
“Planners will need better tools to monitor demand, adoption, and equity.” said Justin Dennis, COO, Urban SDK. “Right now, 280 million Americans do not have equitable access to EV chargers. To optimize state by state plans for deployment, we wanted to benchmark current network adoption, access, scarcity, and the economic impact on our communities.”
Urban SDK’s NEVI Rank tool compares states’ public EV charging networks and then identifies benchmarks for availability, use, demand, and equity.
“Our goal with NEVI Rank is to identify opportunities, goal posts for infrastructure investment, and a baseline for trend analysis over the next 5 years,” said Dennis. “Today only 23 States have formal EV plans. We hope the tool enables state department of transportation planners and policymakers to build better EV plans with equity in mind. The analysis shows that the current state of EV Chargers are exclusive and we need to do more to make EV adoption a possibility in lower income communities.”2.
Urban SDK has released a white paper analysis and a publicly available dataset to provide States with a comparison tool, along with an EV utilization database from existing chargers for Q2 2022.
National EV Benchmarks
Ther report, which provides a snapshot of the EV charger infrastructure in Q2 2022, illustrated:
- Only 13% of the US population has equitable public access to EV chargers.
- Median household income in census tracts with EV chargers are 12.1% higher than those without EV chargers.
- Median home value in census tracts with EV chargers are 44.5% higher than those without EV Chargers.
- The percent of population living in poverty with access to EV is 15.9% less than those without access to EV chargers.
Q2 2022 NEVI Rank Report
The NEVI Rank compares US States public EV Charging networks to identify benchmarks for availability, utilization, demand, and equity. The ranking provides a snapshot of the current EV charger infrastructure, by state, in Q2 2022 based on observation and US Census data.
Ranking criteria was created to allow states to quantify benchmarks to meet NEVI Formula planning requirements for infrastructure investment, maintenance, and operations. The ranking does not include the State of Alaska.
1. EV charger usage, availability and scarcity
The NEVI Rank created a benchmark for current public EV charger adoption. Data was collected from daily utilization and permanent location of 35,052 existing public EV chargers in 49 states and the District of Columbia.
Definition of usage, availability, and scarcity :
- Ratio of EV/100K persons:
- Evaluates the ratio of total number of EV chargers per 100K
- EV/100K = total number of EV chargers per state / total census tract population (in 100K).
- Average % utilization Q2 2022:
- Monitors public EV charger adoption
- Average % utilization = the ratio of EV charger stations occupied time / the total device available time.
- Scarcity:
- Scarcity tracks the demand for a resource that is greater than the supply of that resource.
- Scarcity = Ranking of Average % utilization Q2 2022 - Ranking of EV/100K persons
2. EV charger equity ranking
The equity related rankings are based on the difference between census tract without EV chargers with those with EV chargers aggregated at state level. The state ranking compares the difference at the state level.
Definition of equity :
- Median Home Value:
- Compares the difference in median home prices between census tracts that have and do not have public EV charger(s).
- Difference Median Home Value = (Average Home Value of census tract with chargers - Average Home Value of census tract without chargers / Average Home Value of census tract without chargers)
- Poverty:
- Compares the difference in population at or below poverty between census tract that have and do not have public EV charger(s).
- Poverty = (Total population at or below poverty in census tract with chargers - Total population at or below poverty in census tract without chargers / Total population at or below poverty in census tract without chargers)
- Median Household Income:
- Compares the difference in mean household income between census tracts that have and do not have public EV charger(s).
- Similar to median home value but instead it uses median income for ranking the states.
Q2 2022 NEVI Rank Top 5
1. EV/100K Persons
Evaluates the ratio of total number of EV chargers per 100K.
Ratio of EV/100K persons rank calculates the difference between the metrics first and then ranking the states from 1 to 50. Where rank 1 means lowest estimated difference and 50 indicates the highest difference.
Average % Utilization Q2 2022
Monitors public EV charger adoption.
Highest Ranking States
Lowest Ranking States
- Louisiana
- Nevada
- Connecticut
- Massachusetts
- California
46. North Dakota
47. Mississippi
48. Idaho
49. Montana
50. West Virginia
Average Utilization rank calculates the difference between the metrics first and then ranking the states from 1 to 50. Where rank 1 means lowest estimated difference and 50 indicates the highest difference.
Scarcity
Scarcity tracks the demand for a resource that is greater than the supply of that resource
Highest Ranking States
Lowest Ranking States
- Louisiana
- Connecticut
- Illinois
- Oklahoma
- Hawaii
46. Washington
47. Oregon
48. Missouri
49. Kansas
50. Hawaii
Scarcity rank calculates the difference between the Utilization and EV/100K persons. Where the greater the difference the higher the rank. Scarcity can be viewed as a lack of resources or demand.
Median Home Value
Compares the difference in median home prices between census tracts that have and do not have public EV charger(s).
Highest Ranking States
Lowest Ranking States
- New York
- Hawaii
- Utah
- Maryland
- Nebraska
46. Georgia
47. Pennsylvania
48. Texas
49. Kansas
50. Wyoming
Median Home Value rank calculates the difference between the metrics first and then ranking the states from 1 to 50. Where rank 1 means lowest estimated difference and 50 indicates the highest difference.
Poverty
Compares the difference in population at or below poverty between census tract that have and do not have public EV charger(s).
Highest Ranking States
Lowest Ranking States
- Hawaii
- Idaho
- Arkansas
- Iowa
- Delaware
46. Kansas
47. New Jersey
48. Illinois
49. Wyoming
50. District of Columbia
Poverty rank calculates the difference between the metrics first and then ranking the states from 1 to 50. Where rank 1 means lowest estimated difference and 50 indicates the highest difference. Yes, we know DC is not a State.
Median Household Income
Compares the difference in mean household income between census tracts that have and do not have public EV charger(s).
Highest Ranking States
Lowest Ranking States
- New Mexico
- Oregon
- Utah
- Idaho
- Nevada
46. New Jersey
47. District of Columbia
48. Pennsylvania
49. Illinois
50. Kansas
Median household income rank calculates the difference between the metrics first and then ranking the states from 1 to 50. Where rank 1 means lowest estimated difference and 50 indicates the highest difference.
The NEVI Ranking Tool
The NEVI Rank can be used to examine regions, states, census tracts, and individual charger locations. Additionally the dataset can be used for advanced site selection modeling that incorporates trip data, roadways, and regional travel demand typically used by departments of transportation and planning authorities.
NEVI Rank Map Tool Highlights
National Benchmarks
Users can view national benchmarks of charger demand, equity, access metrics by State.

NEWS
Recent Announcements
See how public sector leaders succeed with Urban SDK.

Company News
Urban SDK Joins Government Technology’s AI Council to Help Shape the Future of AI in the Public Sector
We’re proud to announce that Urban SDK has officially joined the AI Council, part of Government Technology’s Center for Public Sector AI
Company News
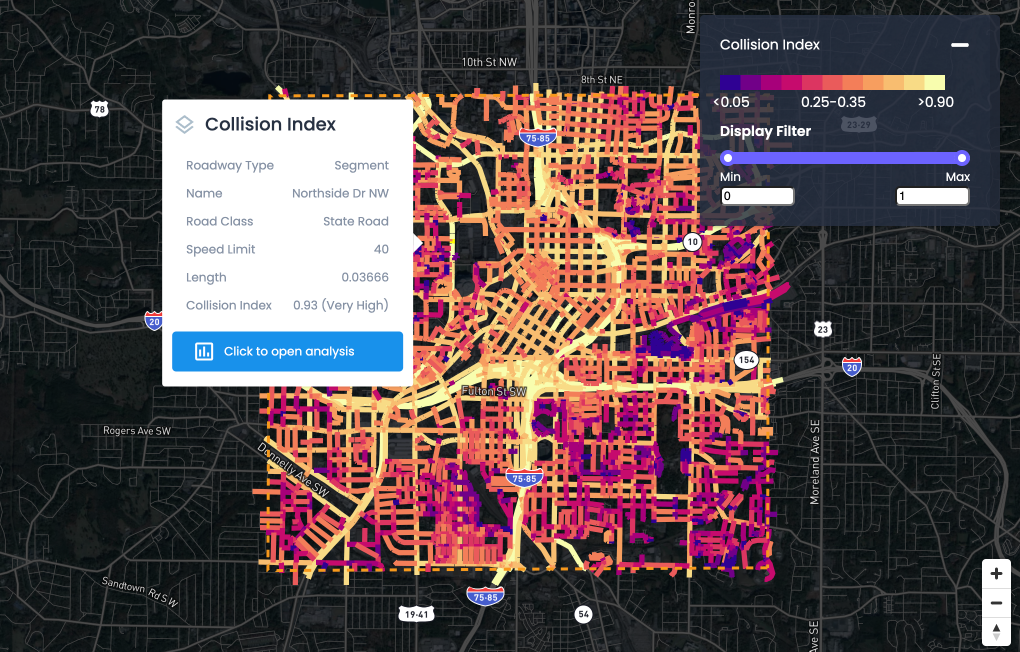
Collision Index: Proactive Traffic Safety Powered by AI
Communities now have another layer of road safety thanks to Urban SDK’s Collision Index

Customer Stories
University of Florida Transportation Institute Partners with Urban SDK to Expand I-STREET Program
Urban SDK and the University of Florida have partnered to expand the university's I-STREET Program
WEBINAR
Identify speeding and proactively enforce issues
See just how quick and easy it is to identify speeding, address complaints, and deploy officers.
