

Travel Time & Reliability Sample
The sample dataset is available on Desktops only.
Check your email for a link to the map.
View one month in Longboat Key, FL. Data is provided to users by on demand request and updated monthly. We maintain historical data
Trusted by 300+ Communities IN NORTH AMERICA


%203.png)


%203.png)
%203.png)
%202.png)
%203.png)
%202.png)

%203.png)


%202.png)


Identify speeding and resolve public complaints
Identify speeding and validate public complaints on any road in a matter of minutes.
61 MPH
85th Percentile Speed
Speed Limit
50 MPH
Average
54 MPH
95%
64 MPH

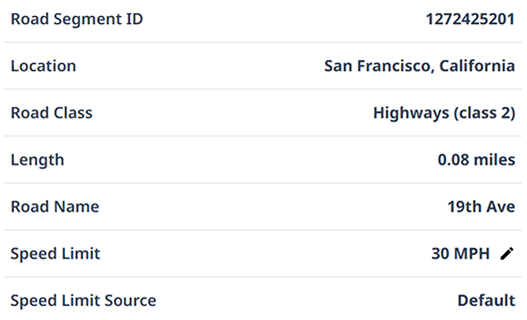
Road Segment ID
776737347
Location
San Francisco, California
Road Class
State Roads (class 3)
Length
0.08078 miles
Road Name
2A
Speed Limit
50 MPH
Speed Limit Source
Urban SDK
Data Layer
Traffic Speed
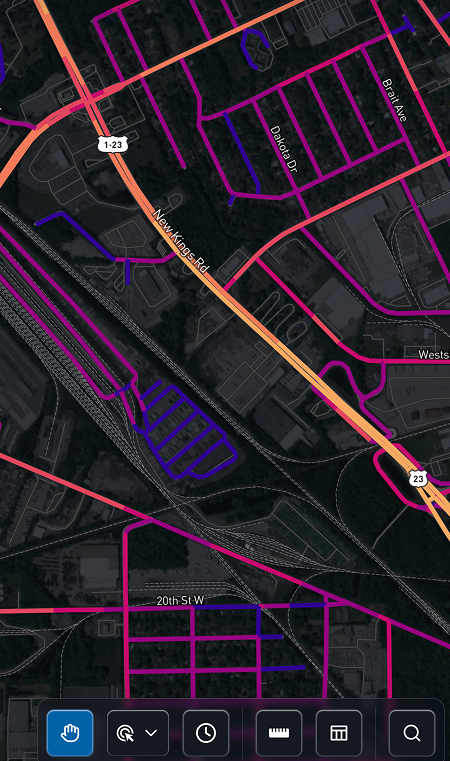
Gain access to traffic speed from connected vehicles on all your local roads. Insights reports allow users to gauge roadways with average, percentile speeds, and filter by time period or date ranges.
Urban SDK provides precise hourly speed data to evaluate complaints and deploy resources efficiently for the greatest impact to public safety.
Urban SDK provides precise hourly speed data to evaluate complaints and deploy resources efficiently for the greatest impact to public safety.

Daily Traffic
Traffic speeds are reported hourly on all roads without any hardware.

Road Network
Traffic speeds are associated with global linear referencing.

Customizable Analysis & Reporting
Filter traffic data to easily create custom reporting
- Speeds
- Speed Limit
- Road Class
- Segments
- Jurisdiction
- Time Period
- Date Range
- Day of Week
- Custom Route
- Custom Radius, Area, or Zone
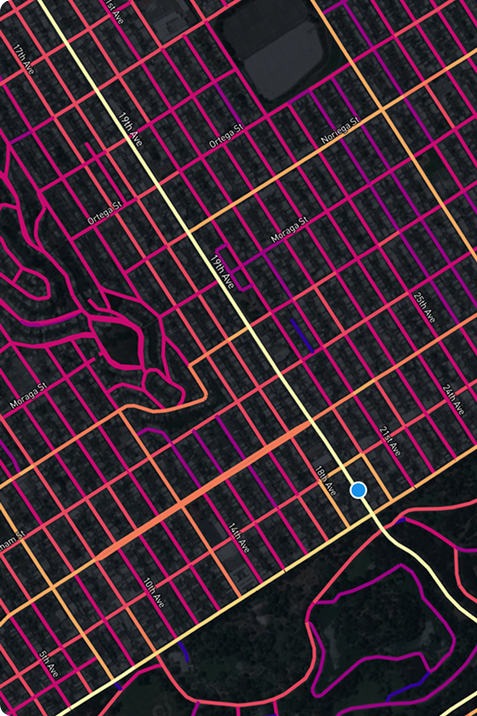
Quickly Identify Speeding to Position Enforcement
Visualize hotspots and compare speeds against posted speed limits.
12 MPH
Over Speed Limit
Speed Limit
45 MPH
85% Difference
12 MPH
95% Difference
17 MPH

Road Segment ID
120906391
Location
San Francisco, California
Road Class
Local (class 5)
Length
0.17523 miles
Road Name
New Kings Rd.
Speed Limit
45 MPH
Speed Limit Source
Urban SDK
Data Layer
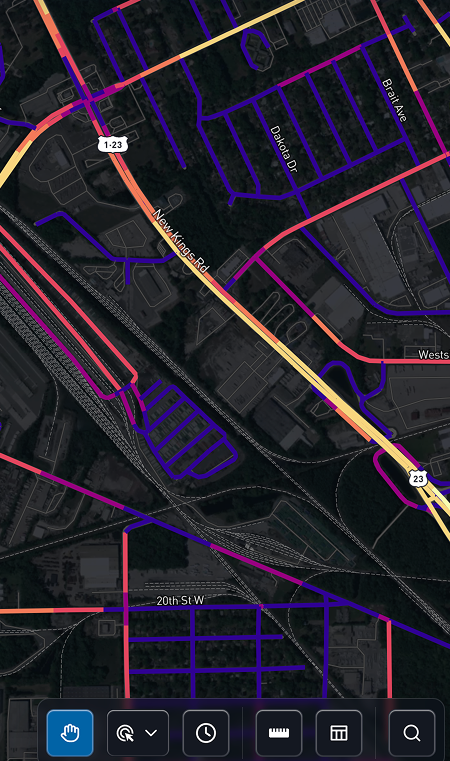
Speed Limit Difference
Compare hourly speeds of observed trips on every road segment against the posted speed limit.
Urban SDK provides precise hourly speed data to evaluate complaints and deploy resources efficiently for the greatest impact to public safety.
Urban SDK provides precise hourly speed data to evaluate complaints and deploy resources efficiently for the greatest impact to public safety.
Average Difference
Compare average hourly traffic speeds.
85th & 95th
Compare 85th or 95th percentile hourly traffic speeds.
Import Speed Limits
Import your local speed limit files at any time or leverage Urban SDK's continuous speed limit index.
Mitigate collision risk with road scoring
Identify and rank roads with the highest collision risk from an annual road score.
.png)
0.82 Very High Risk
Collision Index
.png)
Data Layer
Collision Index
Using an index of 5-year historical fatal crashes, traffic volumes, speeding, roadway and neighborhood characteristics, officials can pinpoint hotspots across their entire roadway network.
Urban SDK provides precise hourly speed data to evaluate complaints and deploy resources efficiently for the greatest impact to public safety.
Urban SDK provides precise hourly speed data to evaluate complaints and deploy resources efficiently for the greatest impact to public safety.
Risk Score
The collision index creates a risk score value for each road segment ranging from 0 to 1
Dangerous Roads
Identify and monitor high collision corridors with bookmarks to alert traffic enforcement
Compare trends pre- and post- enforcement
Collision index models risk with collisions, traffic, and roadway design
- Intersection widths
- Sidewalks & facility widths
- School Zones
- Traffic Speed
- Collisions
- Signage
Get traffic volume on every road without hard counts
Daily and annual traffic volumes are available on every road. Counts are refreshed automatically.
2,400 Vehicles / Hour
AAHT
Road Segment ID
23614104
Location
San Francisco, California
Road Class
Local (class 5)
Length
0.06338 miles
Road Name
Pierce St
Speed Limit
30 MPH
Speed Limit Source
Urban SDK
Data Layer
Traffic Volume
Gain access to VMT and AADT on all your local roads with Urban SDK’s Traffic Volume Data. See how many cars are traveling along your roadways, and quickly share what roads are operating at capacity.
Urban SDK provides precise hourly speed data to evaluate complaints and deploy resources efficiently for the greatest impact to public safety.
Urban SDK provides precise hourly speed data to evaluate complaints and deploy resources efficiently for the greatest impact to public safety.
Annual Average Daily Traffic
Annual average daily traffic (AADT) measures how much traffic uses a road or highway in a year.
Vehicle Miles Traveled
Vehicle miles traveled (VMT) measures the amount of travel for all vehicles over a segment.
Frequently asked questions:
We acquire data from vehicle telematics and connected vehicle sources aggregated by OEM manufacturers. Our data is the same as used by the FHWA The National Performance Management Research Data Set (NPMRDS) Source.
We are happy to validate our dataset against ground truth or recent speed studies.
Urban SDK Insights analytics provides you with a comprehensive speed enforcement tool to analyze speeds on all roads in your county, municipal, or custom boundary for your jurisdiction. Your officers can login online or access automated traffic enforcement reporting via email.
Urban SDK Insights accounts will have a minimum of 13 months historical data from the day a new account is created.
Urban SDK can provide historical backfills upon request.
Get 30 days free
traffic data in any city
See just how quick and easy it is to identify speeding, address complaints, and deploy officers.
Request access
