
Articles
See how public sector leaders succeed with Urban SDK.

Traffic Volumes
Building Internal Traffic Analysis Capacity: A Roadmap for Reducing Consultant Reliance
Cities cut consultant reliance with mobility data to validate traffic calming, stop-control requests, and speed concerns using Urban SDK.
Traffic Volumes
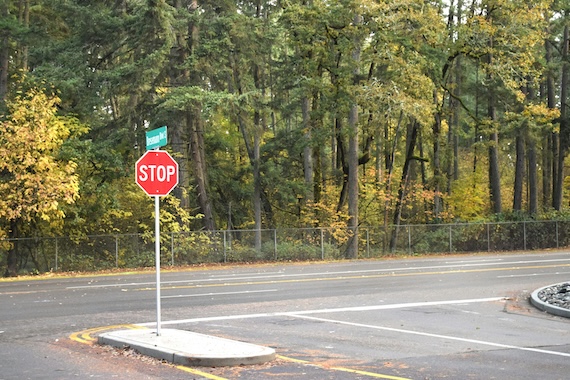
How Cities Can Use Traffic Volume Variability to Evaluate Stop-Control Warrants
Cities use traffic volume and continuous data to assess stop-control warrants, prioritize requests, and make decisions with Urban SDK.

Transportation Planning
Understanding the 85th Percentile Rule: A Practical Guide Traffic Engineering
Learn how 85th percentile speeds guide traffic decisions and how continuous data helps cities validate requests, boost safety with Urban SDK

Road Safety
Speeding Perception vs. Reality: What Data Reveals About Neighborhood Traffic Concerns
Residents often misjudge speeding; continuous data helps cities verify concerns, spot true hotspots, and respond faster with Urban SDK.

Traffic Calming
How Cities Can Replace Physical Speed Studies With Continuous Roadway Monitoring
Cities use continuous road monitoring to validate speeding complaints faster, cut costs, and improve traffic safety with Urban SDK.

Traffic Calming
A Modern Framework for Handling Resident Speeding Complaints With Data Transparency
See how cities use real-time speed data to resolve speeding complaints faster, boost transparency, and build community trust with Urban SDK.
Transportation Planning
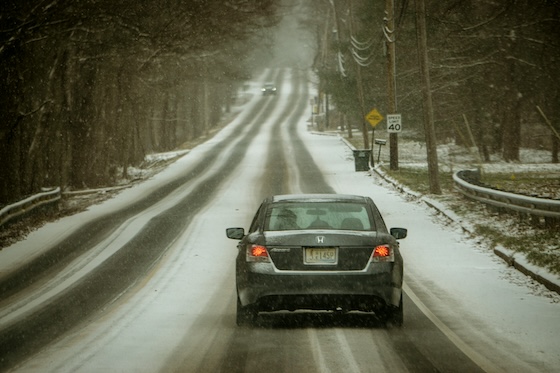
Winter Mobility Planning: How Traffic & Road Data Helps Cold-Climate Cities
See how traffic data help cities optimize snow plow routes, allocate resources efficiently, and keep roads safe during winter storms.
Congestion Management
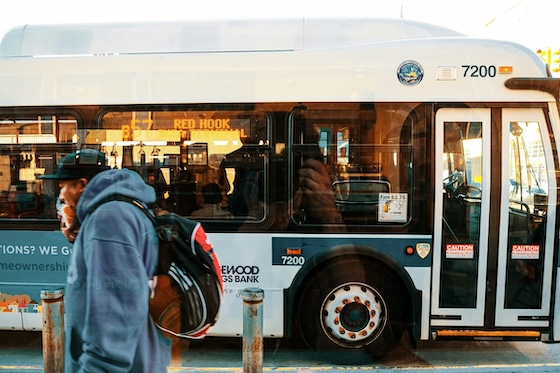
Using Mobility Data to Keep Public Transit in Check and Make It Better
How mobility data helps transit agencies track on-time performance, optimize routes, improve reliability, and boost ridership.

Transportation Planning
Mobility Data for Climate Action: Measuring Sustainable Transportation Progress
Discover how data turns climate goals into measurable, sustainable transport progress.

Transportation Planning
How EV Infrastructure Planning Relies on Road and Traffic Data
Discover how planners use road and traffic data to design efficient EV charging networks.

Transportation Planning
Mobility Data Privacy: What City Agencies Need to Know in 2026
By 2026, cities must balance mobility data use and privacy. Learn key practices for geolocation data and complying with new privacy laws.

Traffic Volumes
Comparing Ways to Collect Data: GPS, Sensors, Crowdsourced, and Manual Counts
How cities collect mobility data using manual counts, fixed sensors, GPS, and crowdsourced methods to give better traffic insights

Transportation Planning
City Traffic Dashboards: Tips for Displaying Mobility Data
Learn how to design city traffic dashboards that display mobility data clearly for smarter urban planning

Transportation Planning
How to Use Road Segment Data to Prioritize Infrastructure Investments
How urban planners use detailed road segment data to prioritize infrastructure investments and make data-driven repair decisions.

Transportation Planning
Traffic Data for Freight & Logistics: Key Metrics for Urban Planners
Essential metrics urban planners must track to manage freight flows, curb congestion and optimize city logistics
WEBINAR
Identify speeding and proactively enforce issues
See just how quick and easy it is to identify speeding, address complaints, and deploy officers.
